Overview
From the JCarder website:
- JCarder is an open source tool for finding potential deadlocks in concurrent multi-threaded Java programs. It does this by instrumenting Java byte code dynamically (i.e., it is not a tool for static code analysis) and looking for cycles in the graph of acquired locks.
In particular, JCarder functions by recording each time a monitor lock is obtained or released by any thread on any object. After the program has terminated, the recorded data can be analyzed to look for lock inversion cycles. This doesn't tell us whether a deadlock occurred, but rather whether a deadlock might occur in other possible thread interleavings of the program.
Effectiveness
In general, the newest version of JCarder tends to have few false positives, as lock inversions are almost always a very bad thing. However, JCarder is not exhaustive, as there are more ways to produce a deadlock than lock inversion.
Getting JCarder
The most recent JCarder release at the time of this writing (1.0.1) is too old to be used with Hadoop. In particular, it is missing gated cycle detection, and therefore produces a ton of false positives. Therefore, you must compile a trunk version of JCarder for the time being. You can obtain a version that works well with Hadoop from Todd Lipcon's github repository:
$ git clone git://github.com/toddlipcon/jcarder.git
$ cd jcarder
$ git checkout -b cloudera origin/cloudera
or, if you prefer not to use git:
$ wget http://github.com/toddlipcon/jcarder/tarball/cloudera
$ tar xzvf toddlipcon-jcarder*tar.gz
$ cd toddlipcon-jcarder-XXXXX
Compile jcarder by running:
$ ./script/download-3pps.py
$ ant dist
Starting Hadoop daemons with JCarder
JCarder instruments the Hadoop daemons at runtime using the Java Agent functionality. You simply have to pass the correct flag to the JVM in order to run a daemon under jcarder:
$ HADOOP_OPTS=-javaagent:/home/todd/toddlipcon-jcarder-1b7f1be/dist/jcarder.jar=outputdir=/tmp/dn-jcarder ./bin/hdfs datanode &
$ HADOOP_OPTS=-javaagent:/home/todd/toddlipcon-jcarder-1b7f1be/dist/jcarder.jar=outputdir=/tmp/nn-jcarder ./bin/hdfs namenode &
$ HADOOP_OPTS=-javaagent:/home/todd/toddlipcon-jcarder-1b7f1be/dist/jcarder.jar=outputdir=/tmp/jt-jcarder ./bin/mapred jobtracker &
$ HADOOP_OPTS=-javaagent:/home/todd/toddlipcon-jcarder-1b7f1be/dist/jcarder.jar=outputdir=/tmp/tt-jcarder ./bin/hdfs tasktracker &
The outputdir= option should point to a directory with at least few hundred MB of space free, especially if you plan to run the daemon for a while. Each process should point to its own outputdir.
Exercise the Code
In order to be useful, JCarder needs visibility into all of the lock orders present in the code. So, at this point you should exercise whichever code paths you are concerned about, as well as any code paths you think it may deadlock with. For example, if testing a scheduler for deadlocks, you should run several jobs and browse the JT web UI. Using a few mradmin commands as well may exercise other code paths.
Shut down the cluster
Simply kill the nodes like you normally would. They'll write their jcarder output to the specified directories.
Analyze JCarder output
Simply cd into each output directory in turn, and run jcarder.jar as a normal java executable.
$ cd /tmp/jt-jcarder
$ java -jar /path/to/jcarder.jar
This will generate output something like:
Opening for reading: /tmp/jt-jcarder/jcarder_contexts.db
Opening for reading: /tmp/jt-jcarder/jcarder_events.db

Loaded from database files:
   Nodes: 3085
   Edges: 31411 (excluding 332593 duplicated)

Cycle analysis result:
   Cycles:          61
   Edges in cycles: 63
   Nodes in cycles: 3
   Max cycle depth: 2
   Max graph depth: 5

Ignoring 48 almost identical cycle(s).

Writing Graphviz file: /tmp/jt-jcarder/jcarder_result_0.dot
Writing Graphviz file: /tmp/jt-jcarder/jcarder_result_1.dot
In this case, jcarder has identified two deadlocks (which I've introduced for the sake of the example). The two .dot files are GraphViz format and can be viewed, for example, with ImageMagick's "display" command or any number of other applications. It's a text format, but the graphics are far easier to understand.
Interpreting the Output
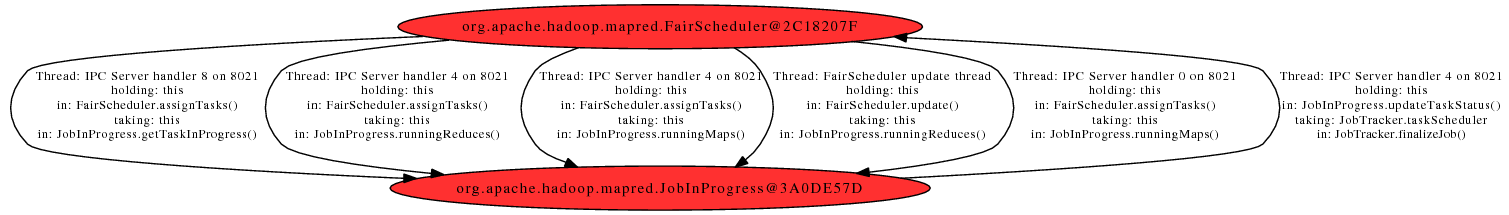
In the output, each circle represents a particular object seen while the process was running. Arrows between them represent lock orders seen. An arrow leading from circle A to circle B indicates that some thread locked A before B. For example, in the following diagram, we note that many threads locked FairScheduler before JobInProgress, but one thread was seen to lock JobInProgress before FairScheduler (thus presenting a deadlock). The text next to the arrow indicates the particular functions that took the two locks.
Running JCarder on unit tests
One can also run JCarder on all of the Hadoop unit tests. This has caught a number of bugs in the past. To do so, follow something like the following script:
export JCARDER_JAR=/path/to/jcarder.jar
export JC_OUTPUT=/tmp/jcarder
mkdir -p $JC_OUTPUT
# the silly @"TIME"@ on the next line is only because the Hadoop wiki wants to
# run a time insertion macro.
JAVA_TOOL_OPTIONS="-javaagent:$JCARDER_JAR=outputdir=$JC_OUTPUT/jc-@"TIME"@" ant test

for x in $JC_OUTPUT/jc-* ; do
  pushd $x > /dev/null
  java -jar $JCARDER_JAR > analysis.log
  popd > /dev/null
done

find $JC_OUTPUT -name \*.dot
Note that this method actually will run JCarder on ant itself as well as the tests. I have often seen cycles detected in ant, as well as third party libraries like hsqldb. Whitelist support is forthcoming in JCarder so we can ignore these unrelated issues.