See also: SolrPerformanceFactors, SolrPerformanceData, BenchmarkingSolr
This page will attempt to answer questions like the following:
- Why is Solr performance so bad?
- Why does Solr take so long to start up?
- Why is SolrCloud acting like my servers are failing when they are fine?
This is an attempt to give basic information only. For a better understanding of the issues involved, read the included links, look for other resources, and ask well thought out questions via Solr support resources.
This guide does not contain info specific to Solr installs that are using HDFS for index storage. If anyone has any info about how to achieve effective index data caching with HDFS, please share that information with the solr-user mailing list or the #solr channel in the ApacheSolr slack space so it can be incorporated here.
General information
There is a performance bug that makes *everything* slow in versions 6.4.0 and 6.4.1. The problem is fixed in 6.4.2. It is described by SOLR-10130. This is highly version specifica and only applies to VERY old versions, so if you are not running one of the affected versions, don't worry about it. The rest of this document outside of this one paragraph is not specific to ANY version of Solr.
A major driving factor for Solr performance is RAM. Solr requires sufficient memory for two separate things: One is the Java heap, the other is "free" memory for the OS disk cache.
Another potential source of problems is a very high query rate. Adding memory can sometimes let Solr handle a higher rate. If more query scalability is required, eventually that won't be enough, and you will need to add multiple replicas of your index on multiple machines (preferably separate physical hardware) to scale further. For standalone Solr instances or when using SolrCloud with clients that are not cloud-aware, multiple replicas might require a load balancer.
It is strongly recommended that Solr runs on a 64-bit Java. A 64-bit Java requires a 64-bit operating system, and a 64-bit operating system requires a 64-bit CPU. There's nothing wrong with 32-bit software or hardware, but a 32-bit Java is limited to a 2GB heap. It is very easy to build an index that will not function at all if the heap cannot be made larger than 2GB. The Java heap is discussed in a later section of this page.
SolrCloud
Regardless of the number of nodes or available resources, SolrCloud begins to have stability problems when the number of collections reaches the low hundreds. With thousands of collections, any little problem or change to the cluster can cause a stability death spiral that may not recover for tens of minutes. Try to keep the number of collections as low as possible. When each collection has many shards, the problem can multiply. These problems are due to how SolrCloud updates cluster state in ZooKeeper in response to cluster changes. Work is underway to try and improve this situation. This problem surfaced in Solr 4.x where the state is kept in a single "clusterstate.json" file. Subsequent Solr versions (5x and above) by default store each collection's data in an individual "state.json" as a child of each collection's znode (e.g. /collections/my_collection/state.json). If you started with a Solr 4x installation, the MIGRATESTATE command will change to the newer, more scalable state. That said, the load on Zookeeper certainly increases as the number of collections (and replicas) increases.
Because SolrCloud relies heavily on ZooKeeper, it can be very unstable if you have underlying performance issues that result in operations taking longer than the zkClientTimeout. Increasing that timeout can help, but addressing the underlying performance issues will yield better results. The default timeout (15 seconds internally, and 30 seconds in most recent example configs) is quite long and should be more than enough for a well-tuned SolrCloud install.
ZooKeeper's design assumes that it has extremely fast access to its database. If the ZooKeeper database is stored on the same disks that hold the Solr data, any performance problems with Solr will delay ZooKeeper's access to its own database. This can lead to a performance death spiral where each ZK timeout results in recovery operations which cause further timeouts.
ZooKeeper holds its database in Java heap memory, so disk read performance isn't quite as critical as disk write performance. In situations where the OS disk cache is too small for Solr's needs and the ZK database is on the same disk as Solr data, a large amount of disk access for Solr can interfere with ZK writes. Using very fast disks for ZK (SSD in particular) will result in good performance. Using separate physical disks for Solr and ZK data is strongly recommended. Having dedicated machines for all ZK nodes (a minimum of three nodes are required for redundancy) is even better, but not strictly a requirement.
High Request Rate
If your request rate is high, that will impact performance, often very dramatically. Determining what qualifies as "high" is not straightforward. Some servers can easily handle 200 requests per second, others will struggle to handle 10 per second. If your request rate is above about 30 per second, it's probably time to think about scaling your install by adding additional copies of your index and additional servers. Handling thousands of requests per second will require a LOT of hardware.
Handling a high query rate usually involves setting up multiple copies of your index on multiple servers and implementing some kind of load balancing. SolrCloud can automate a lot of this, and it does load balancing internally, but you might still need an external load balancer.
RAM
OS Disk Cache
For index updates, Solr relies on fast bulk reads and writes. For search, fast random reads are essential. The best way to satisfy these requirements is to ensure that a large disk cache is available. Visit Uwe's blog entry for some good Lucene/Solr specific information. You can also utilize Solid State Drives to speed up Solr, but be aware that this is not a complete replacement for OS disk cache. See the SSD section later in this document for more details.
In a nutshell, you want to have enough memory available in the OS disk cache so that the important (frequently accessed) parts of your index will fit into the cache. Let's say that you have a Solr index size of 8GB. If your OS, Solr's Java heap, and all other running programs require 4GB of memory, then an ideal memory size for that server is at least 12GB. You might be able to make it work with 8GB total memory (leaving 4GB for disk cache), but that also might NOT be enough. The really important thing is to ensure that there is a high cache hit ratio on the OS disk cache ... not to achieve perfection.
If you need the your overall query latency to be as low as possible, your best bet is to have sufficient system memory to fully cache the entire index. If you don't need minimal latency, caching the entire index may not be necessary.
The exact minimum requirements are highly variable and depend on things like your schema, your index contents, and your queries. If your index has a lot of stored fields, those requirements would be on the smaller end of the scale. If you have very little stored data, you would want to be on the higher end of the scale. The size of stored data doesn't affect search speed very much, though it might affect how long it takes to retrieve the search results once the required documents have been determined.
![]() It's very important to note here that there is no quick formula available for deciding the minimum amount of memory required for good performance. Setting up a full system may be the only way you can know. Sometimes a small-scale prototype can reveal useful information. See this article for a discussion on this topic.
It's very important to note here that there is no quick formula available for deciding the minimum amount of memory required for good performance. Setting up a full system may be the only way you can know. Sometimes a small-scale prototype can reveal useful information. See this article for a discussion on this topic.
Special note regarding the optimize operation
Optimizing your index results in a large amount of disk I/O. If you don't have enough OS disk cache to effectively cache your index, an optimize operation can be *very* disruptive to normal Solr operation. If optimizes are something that will happen frequently, it may be a requirement that you have enough RAM to cache at least 100 percent of your index contents. Performance during an optimize will be best if you have enough RAM to cache both the original and the optimized versions of the index at the same time. This note can also apply to slave servers doing replication, if a large merge or an optimize happens on the master server.
Java Heap
The java heap is the memory that a java program (such as Solr) requires in order to actually run.
You might end up here if you are seeing OutOfMemoryError (OOME) exceptions in your log. If you are seeing this, your Solr install needs more of some resource than it is allowed to access. There are only two choices for dealing with OOME. One is to increase the size of the resource that is running out, the other is to reduce the amount of that resource that Solr needs. It is usually heap memory that triggers OOME, but it could be some other resource, like the number of threads/processes that are allowed to run. Some might say there's a third option: Fix the bug in the program that makes it require so many resources. That is not really a third option – it falls under the second one.
Certain configurations and conditions in Solr will require a lot of heap memory. The following list is incomplete, but in no particular order, these include:
- A large index.
- Frequent updates.
- Super large documents.
- Extensive use of faceting.
- Using a lot of different sort parameters.
- Very large Solr caches
- A large RAMBufferSizeMB.
- Use of Lucene's RAMDirectoryFactory.
How much heap space do I need?
The short version: This is one of those questions that has no generic answer. You want a heap that's large enough so that you don't have OOME exceptions and problems with constant garbage collection, but small enough that you're not wasting memory or running into huge garbage collection pauses. Don't follow advice that tells you to use a specific fraction (one quarter, one half, etc) of your total memory size for the heap. You can easily end up with a heap size that's too small or too large by following that advice.
The long version: You'll have to experiment. The Java Development Kit (JDK) comes with two GUI tools (jconsole and jvisulavm) that you can connect to the running instance of Solr and see how much heap gets used over time. For longer-term JVM heap, memory spaces, and garbage collection monitoring, you can use tools like SPM. The post on JVM Memory Pool Monitoring shows what to look for in memory pool reports to avoid OOME.
The chart in this jconsole example shows a typical sawtooth pattern - memory usage climbs to a peak, then garbage collection frees up some memory. Figuring out how many collections is too many will depend on your query/update volume. One possible rule of thumb: Look at the number of queries per second Solr is seeing. If the number of garbage collections per minute exceeds that value, your heap MIGHT be too small. It also might be perfectly fine ... well-tuned garbage collection might do a large number of very quick collections on a frequent basis.
If you let your Solr server run with a high query and update load, the low points in the sawtooth pattern will represent the absolute minimum required memory. Try setting your max heap between 125% and 150% of this value, then repeat the monitoring to see if the low points in the sawtooth pattern are noticeably higher than they were before, or if the garbage collections are happening very frequently. If they are, repeat the test with a higher max heap.
Another way of determining whether the guess you've made for your heap size is correct is to take the GC log that Solr writes and analyze it. The gceasy website has made this analysis quite easy. If you don't already know what you're looking for, share your GC log with one of Solr's support resources to get some help with this.
Additional rule of thumb: More heap is usually better, but if you make it too big, the amount of time spent doing garbage collection can become extreme. That problem will be discussed below. Also, as discussed above, dropping the size of the OS disk cache can create more problems.
Reducing heap requirements
![]() Tuning your garbage collection parameters will NOT reduce the amount of memory that Solr requires! It might make reclaiming memory more efficient, but it can do absolutely nothing to lower the amount of memory that the program needs. It might make the high points in the sawtooth memory graph lower, but it won't do anything about the low points. If you are running into an OutOfMemory error, a change to GC tuning will not help. More efficient garbage collection might cause the program to take longer until OOME occurs, but it cannot prevent it.
Tuning your garbage collection parameters will NOT reduce the amount of memory that Solr requires! It might make reclaiming memory more efficient, but it can do absolutely nothing to lower the amount of memory that the program needs. It might make the high points in the sawtooth memory graph lower, but it won't do anything about the low points. If you are running into an OutOfMemory error, a change to GC tuning will not help. More efficient garbage collection might cause the program to take longer until OOME occurs, but it cannot prevent it.
Here is an incomplete list, in no particular order, of how to reduce heap requirements, based on the list above for things that require a lot of heap:
- Take a large index and make it distributed - break your index into multiple shards.
- One very easy way to do this is to switch to SolrCloud. You may need to reindex but SolrCloud will handle all the sharding for you. This doesn't actually reduce the overall memory requirement for a large index (it may actually increase it slightly), but a sharded index can be spread across multiple servers, with each server having lower memory requirements. For redundancy, there should be multiple replicas on different servers.
- If the query rate is very low, putting multiple shards on a single server will perform well. As the query rate increases, it becomes important to only have one shard replica per server.
- Don't store all your fields, especially the really big ones.
- Instead, have your application retrieve detail data from the original data source, not Solr.
- Note that doing this will mean that you cannot use Atomic Updates.
- You can also enable docValues on fields used for sorting/facets and reindex.
- Reduce the number of different sort parameters. Just like for facets, docValues can have a positive impact on both performance and memory usage for sorting.
- Reduce the size of your Solr caches.
- Reduce RAMBufferSizeMB. The default in recent Solr versions is 100.
- This value can be particularly important if you have a lot of cores, because a buffer will be used for each core.
- Don't use RAMDirectoryFactory - instead, use the default and install enough system RAM so the OS can cache your entire index as discussed above.
GC pause problems
When you have a large heap (larger than 2GB), garbage collection pauses can be a major problem. This is usually caused by occasionally required full garbage collections that must "stop the world" – pause all program execution to clean up memory. There are two main solutions: One is to use a commercial low-pause JVM like Zing, which does come with a price tag. The other is to tune the free JVM you've already got. GC tuning is an art form, and what works for one person may not work for you.
Using the ConcurrentMarkSweep (CMS) collector with tuning parameters is a very good option for for Solr, but with the latest Java 7 releases (7u72 at the time of this writing), G1 is looking like a better option, if the -XX:+ParallelRefProcEnabled option is used. Information from Oracle engineers who specialize in GC indicates that the latest Java 8 will noticeably improve G1 performance over Java 7, but that has not been confirmed. Here are some ideas that hopefully you will find helpful:
Manually tuning the sizes of the various heap generations is very important with CMS. The G1 collector automatically tunes the sizes of the generations as it runs, and forcing the sizes will generally result in lower performance.
If your max heap is just a little bit too small, you may end up with a slightly different garbage collection problem. This problem is usually quite a bit worse than the problems associated with a large heap: Every time Solr wants to allocate memory for operation, it has to do a full garbage collection in order to free up enough memory to complete the allocation. Full garbage collections will pause the JVM, and they are very slow. If the heap size and GC are well-tuned, such full collections are very rare.
Asking for too many rows
Asking for millions of rows with e.g. rows=9999999 in combination with high query rate is a known combination that can also cause lots of full GC problems on moderate size indexes (5-10mill). Even if the number of actual hits are very low, the fact that the client requests a huge number of rows will cause the allocation of tons of Java objects (one ScoreDoc per row requested) and also reserve valuable RAM (28 bytes per row). So asking for "all" docs using a high rows param does not come for free. You will see lots of garbage collection going on, and memory consumption rising until the point where a full GC is triggered. Increasing heap may help sometimes, but eventually you'll end up with long pauses, so we need to fix the root problem. Read Toke Eskildsen's blog post about the details of the problem and his suggestions for improving Solr's code.
The simple solution is to ask for fewer rows, or if you need to get a huge number of docs, switch to /export, cursorMark, or streaming.
If you have no control over the client you can instead try to set rows in an invariants section of solrconfig, or if it needs to be dynamic, set a cap on the max value allowed through a custom SearchComponent, such as the RequestSanitizerComponent.
Tools and Garbage Collection
Unless the problems are caused by the heap being too small, tools like JVisualVM and JConsole will NOT show that you are having problems with GC pauses. You can only see information about totals and averages.
The following free tools are good at revealing pause problems. There may be more tools available:
SSD
Solid State Disks are amazing. They have high transfer rates and pretty much eliminate the latency problems associated with randomly accessing data.
There is one detail to consider before buying premium disks: If you have enough spare memory for good disk caching, the speed of the disks will make very little difference in the performance of most queries. If there is not enough memory for good caching, then disk speed can make a difference, but adding memory will usually offer a better performance increase.
In situations where memory is not quite sufficient, if you put your index on a solid state disk, performance will be better than it would be on similar hardware with a standard spinning magnetic disk. Sometimes the performance increase will be enormous, but if you are looking at SSD because your Solr server is having severe performance problems, there's a very good chance that switching to SSD will not help as much as you expect.
Often SSD will be touted as a replacement for RAM used as disk cache. This is both true and untrue. Despite the incredible speed of SSD, RAM (the OS disk cache) is still significantly faster, and RAM still plays a big role in the performance of SSD-based systems. You probably don't need as much RAM with SSD as you do with spinning disks, but you can't eliminate the requirement. With spinning disks you need between 50 and 100 percent of your index size as cache. With SSD, that might be 25 to 50 percent, less if your index is very small.
Note that SSDs are still a young technology and that the amount of independent Solr-oriented performance tests is very limited. One such test indicates that a disk cache of only 10% index size might be enough for high search performance with SSDs. See Memory is overrated. Note that if your index has very few stored fields, 10% may not be enough. If you have a lot of (or very large) stored fields, it might be. Usually the only way to find out if your hardware is sized appropriately is to actually set up a system and try it.
One potential problem with SSD is that operating system TRIM support is required for good long-term performance. For single disks, TRIM is usually well supported, but if you want to add any kind of hardware RAID (and most software RAID as well), TRIM support disappears. At the time of this writing, it seems that only Intel supports a solution and that is limited to Windows 7 or later and RAID 0. One way to make this less of a problem with Solr is to put your OS and Solr itself on a RAID of regular disks, and put your index data on a lone SSD. On a proper Solr setup, if the SSD fails, your redundant server(s) will still be there to handle requests.
Asking for help on a memory/performance issue
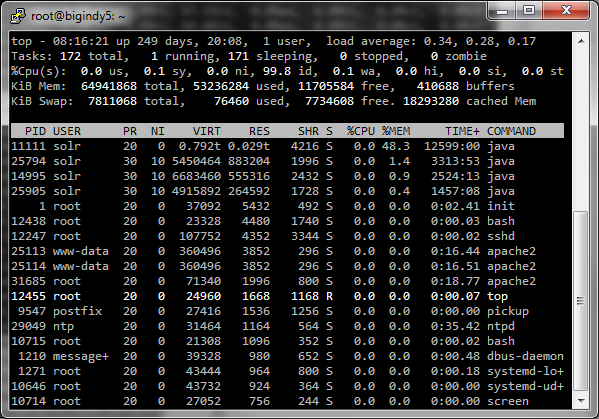
If you ask for help on an issue you're having with performance, which will typically take place either on the solr-user mailing list or the #solr IRC channel, one of the first things that needs to be determined is whether you have enough memory for reasonable performance. Getting certain information from the OS will help determine this. A screenshot of your process information, sorted by memory usage, can answer most of the questions that residents of the mailing list or IRC channel will have.
Process listing on POSIX operating systems
This will involve the utility named "top". There are some other variants of this program available, like htop, which do not provide the information desired. Run the "top" utility. If it's the version of top produced by the Gnu project, you can press shift-M to sort the listing by the %MEM column, descending. If it's another version of top, getting the appropriate sort may require research. Once the correct sort is achieved, grab a screenshot. Share the screenshot with a file sharing website.
Example, with 28GB heap and over 700 GB of index data:
Process listing on Windows
This will only work on recent versions of Windows. Hopefully it will be a Server edition, 2008 or newer, 64-bit. Run the program named Resource Monitor. Click on the Memory tab, then resize the window and the columns so that things can be seen clearly. Click on the "Working Set" column until the sort is descending within that column. Grab a screenshot. If you press Alt-PrintScreen the contents of the window will end up in the clipboard and you can paste them into a program like Paint. Share the screenshot with a file sharing website.
This screenshot example is from a machine that's NOT actually running Solr, but other than that detail, shows what's required:

Extreme scaling
Hardware requirements start to become extreme when the Solr index reaches billions of documents and hundreds of gigabytes, *especially* if there is a high query rate. Handling indexes of this size becomes very expensive, because it usually requires a lot of servers that each have a lot of memory. SSD becomes even more critical, which drives the cost up.
This section needs expanding and information from real deployments of extreme size.
Slow startup
There are two main causes for slow startup. One is related to the transaction log, the other is related to the Suggester component.
Slow startup due to the transaction log
Although there could be other causes, the most common reason for this problem is the updateLog feature introduced in Solr4.0. The problem is not with the feature itself, but depending on how other parts of Solr are configured and used when the feature is turned on, the transaction log can grow out of control.
The updateLog feature adds a transaction log for all updates. When used correctly, the transaction log is a good thing, and it is required for SolrCloud. This version also introduced the concept of a soft commit.
If you send a large number of document updates to your index without doing any commits at all or only doing soft commits, the transaction log will get very very large. When Solr starts up, the entire transaction log is replayed, to ensure that index updates are not lost. With very large logs, this goes very slowly. Large logs can also be caused by a large import using the DataImportHandler, which optionally does a hard commit at the end.
To fix the slow startup, you need to keep your transaction log size down. The only way to do this is by sending frequent hard commits. A hard commit closes the current transaction log and starts a new one. Solr only keeps enough transaction logs around to be able to restore the last 100 documents that were indexed, but it cannot rip apart an individual log file, so if the newest log file is very very large, it must keep the whole thing and replay it at startup. Replaying small transaction logs goes quickly, so keeping them very small (only a few hundred or a few thousand updates) is preferred.
Turning on autoCommit in your solrconfig.xml update handler definition is the solution:
<updateHandler class="solr.DirectUpdateHandler2">
  <autoCommit>
    <maxDocs>25000</maxDocs>
    <maxTime>300000</maxTime>
    <openSearcher>false</openSearcher>
  </autoCommit>
  <updateLog />
</updateHandler>
![]() One reason that people will send a large number of updates without doing any commits is that they don't want their deletes or updates to be visible until they are all completed. This requirement is maintained by the openSearcher=false setting in the above config. If you use this option, you will need to send an explicit hard or soft commit to make the changes visible.
One reason that people will send a large number of updates without doing any commits is that they don't want their deletes or updates to be visible until they are all completed. This requirement is maintained by the openSearcher=false setting in the above config. If you use this option, you will need to send an explicit hard or soft commit to make the changes visible.
You'll want to adjust the maxDocs and maxTime parameters in your autoCommit configuration to fit your requirements. The values provided (25000 docs or five minutes) are good general-purpose defaults, but they may require adjustment in situations with a very high or very low update volume.
Slow startup due to the suggester component
If you have a large index and have the suggester component in your solrconfig.xml, this can cause EXTREMELY long startup times. As of the 4.10.2 version, this component is enabled by default in the main example config.
One issue that describes the problem is SOLR-6679, fixed in 4.10.3. Changes for this problem were also made in SOLR-6845 in the 5.1 version.
The fix involves editing the config to remove or comment the suggester component, as was done in this Heliosearch commit.
Slow commits
Normally only commits that open a new searcher will be slow. The major causes of slow commit times include:
- Large autowarmCount values on Solr caches.
- Heap size issues. Problems from the heap being too big will tend to be infrequent, while problems from the heap being too small will tend to happen consistently.
- Extremely frequent commits.
- Not enough OS memory for disk caching, discussed above.
If you have large autowarmCount values on your Solr caches, it can take a very long time to do that cache warming. The filterCache is particularly slow to warm. The solution is to reduce the autowarmCount, reduce the complexity of your queries, or both.
If you commit very frequently, you may send a new commit before the previous commit is finished. If you have cache warming enabled as just discussed, this is more of a problem. If you have a high maxWarmingSearchers in your solrconfig.xml, you can end up with a lot of new searchers warming at the same time, which is very I/O intensive, so the problem compounds itself.
If you are having problems with slow commit times when NOT opening a new searcher, then this is probably due to general performance problems. Some of these issues are discussed earlier on this page.
Slow Indexing
There are *MANY* reasons for slow indexing. Most of the time it will not be Solr that is slow. The biggest reason for slow indexing is the speed of information retrieval from the source system.
Other possible problems that cause slow indexing include committing after every update request, sending one document at a time in each update request instead of batching them, and only using one thread/connection to index. These are problems that are external to Solr. Possible workaround is using the IgnoreCommitOptimizeUpdateProcessorFactory to ignore all commits from client and instead setup autoCommit.
One part of that needs emphasis. Using only one thread or process for indexing is very often the cause of slow indexing. Using multiple threads or processes to do indexing in parallel will be faster than a single thread. For best results, both the indexing system and the system(s) running Solr should have as many CPU cores as you can get.
Further help
If you need additional help with any of the issues discussed on this page, Solr has a very active community. Be sure that you can provide relevant information before asking for help.