Suggestions and Recipes for Log Analysis
Please add your tips and tricks to this page. Extraction scripts and Excel Macros etc welcome!
See also JmeterMeter - Perl scripts for analysing the run log (jmeter.log)
Generating Appropriate JMeter Logs
The default data logged during JMeter testing is quite sparse - important request and response fields are stored, but the full response sent back by the server is not stored. This is done to avoid bogging down the test client during load testing.
Using the following JMeter parameters on the command line generates log entries with corresponding higher detail for the test run.
-Jjmeter.save.saveservice.data_type=true -Jjmeter.save.saveservice.label=true -Jjmeter.save.saveservice.response_code=true -Jjmeter.save.saveservice.response_data=true -Jjmeter.save.saveservice.response_message=true -Jjmeter.save.saveservice.successful=true -Jjmeter.save.saveservice.thread_name=true -Jjmeter.save.saveservice.time=true"
The JMeter timestamp_format parameter can be used to specify logentry timestamps format. For eg:
-Jjmeter.save.saveservice.timestamp_format="yyyy-MM-dd HH:mm:ss"
As of April 2006, JMeter 2.1.1 must also be run with the following flag to ensure logfile uniformity:
-Dfile_format.testlog=2.0
This forces JMeter to use the old logformat which generates <sampleResult> element for all log entries. The newer format instead generates <httpSample> elements for HTTP requests and <sampleResult> for JDBC sampler entries - this is inconvenient from a automated log processing point of view. Refer this Jmeter-user thread for more details
The above settings can also be defined as global properties in the jmeter.properties configuration file, or in the user.properties file.
The JMeter Log Format
The format of JMeter log entries generated when using the flags in the previous section is defined in the table below. (Editing note: 4 spaces are used to denote one level of XML 'indentation'.)
XML Element | Explanation |
| Root element for XML test log |
@version | Version of test results. Currently (JMeter 2.1.1), set to "1.1" irrespective of testlog format flag. |
/sampleResult/... | All log data is stored under an array of 'sampleResult' elements. |
@timeStamp | Timestamp - See Java method System.currentTimeMillis() |
@dataType | Datatype - typically "text" |
@threadName | Name set for the thread group, with affixed at the end " <iteration>-<thread_id>". For eg "Integration Tests Thread Group 1-1" |
@label | Label set for the sampler. For eg "Login to Custom URL using test account credentials" |
@time | Time in milliseconds for request to complete. Eg "2515" |
@responseMessage | Response message. Eg "OK" |
@responseCode | Response code. Eg "200" |
@success | String indicating status of the request. Can be "true" or "false" |
/sampleResult/... | HTTP Redirects are represented as an array of nested 'sampleResult' elements. Only 1 level of nesting occurs (i.e. the nested subresults do not nest further). |
/property | A string containing POST Data, Query Data and Cookie Data |
@xml:space | XML attribute indicating whether that white space is significant. Set to "preserve" |
@name | Set to "samplerData" |
/assertionResult/... | Assertion information are stored in an array of assertionResult |
@failureMessage | The failure message when the assertion fails |
@error | Set to "true" or "false" to indicate error in assertion (stays "false" on assertion failure) |
@failure | Set to "true" or "false" to indicate whether assertion failed or not |
/binary | Data returned in response |
Perl Based Method for Log Extraction
Here are some steps to import and process JMeter log data in Excel. Steps #3 and 4 are painstaking and can be automated by Excel macros - however, this is beyond my abilities at the moment:
- First, generate delimited file for import into Excel.
I use Perl to parse the XML logs and generate a delimited file for import into Excel. The heart of the Perl script is the regular expression below. Each line in the JMeter logfile must be matched to this expression:
# Regular expression extracts relevant fields from the log entry.
/timeStamp="(\d+)".+?threadName="(.*?)".+?label="(.+?)" time="(\d+?)".+?success="(.+?)"/;

# Data in the regex variables is accessed for use in building suitably-delimited line
my $timestamp = $1; # unix timestamp
my $threadname = $2; # thread label
my $label = $3; # operation label
my $time = $4; # operation time in milliseconds
my $success = $5; # boolean success indicator for this operation
The complexity of the regular expression is required to parse nested log entries that occur during HTTP redirects. A normal log entry line logs one HTTP 'sampler' operation. For eg:
<sampleResult ... time="156" ... />
However, when the opertion had a HTTP redirect (HTTP status code 302), JMeter records the redirects as nested <sampleResult> elements – these which still occur on the same line as the log entry: <sampleResult ... time="2750"> <sampleResult ... time="2468" ... /> <sampleResult time="141" .../> <sampleResult ... time="141" .../> </sampleResult>
The outermost <sampleResult> element has time = 2750 milliseconds. This is the sum of times of the nested redirect elements. We are only interested in the data contained in the outermost element. Hence the regular expression uses the non-greedy pattern match operator ( .*? or .+?) to ignore the latter <sampleResult> elements.
On the other hand, Excel 2002 can directly import JMeter XML format logs. However, it has problems with entries for HTTP 302 redirects. The nested log entry example above will generate three rows in Excel, with the total time repeated thrice. i.e:
Login   2750
Login   2750
Login   2750
2. Convert Timestamps to Excel Format
Once the data is in Excel, I convert the timestamp column from Jmeter's Java timestamp format (base year 1970) to the Excel format (base year 1900 or 1904 depending on the Excel version and underlying OS) using this following formula. This formula is applied to the entire timestamp column.
For GMT time on Windows
=((x/1000)/86400)+(DATEVALUE("1-1-1970") - DATEVALUE("1-1-1900"))
For GMT time on Mac OS X
=((x/1000)/86400)+(DATEVALUE("1-1-1970") - DATEVALUE("1-1-1904"))
For local time on Windows (replace t with your current offset from GMT)
=(((x/1000)-(t*3600))/86400)+(DATEVALUE("1-1-1970") - DATEVALUE("1-1-1900"))
For local time on Mac OS X (replace t with your current offset from GMT)
=(((x/1000)-(t*3600))/86400)+(DATEVALUE("1-1-1970") - DATEVALUE("1-1-1904"))
3. Now sort rows on the operation name (i.e. JMeter sampler name)
4. Generate suitable reports and graphs manually.
For instance, one can generate a graph of page load times v/s time for different operations (e.g.: login, add 1 line to the order, etc). A different series in the graph is needed for each operation type used - this can be quite painstaking to add to a graph when there is a lot of data.
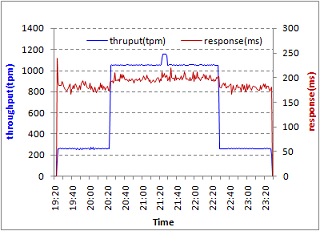
The graphs generated can be quite useful in visualizing performance of websites. See the graph below for an example of one such dummy website. The JMeter test that generated the data imposed a steady "normal load" component, but also imposed two short-term, high volume "surge loads" spread 10 minutes apart. (This was done using a separate JMeter thread group).
DummyWebsitePerformance.JPG!
XSL script to extract Jmeter logs
(Peter Thomas) There are XSL scripts that I found that come along with the Jmeter distribution in the "extras" folder as "jmeter-results-report.xsl" and "jmeter-results-detail-report.xsl". However the HTML rendered is very complex, doesn't work well in Firefox and is bit difficult to grab into Excel.
Here's a simple script that just converts the Jmeter XML into an HTML table and does nothing else. You can do a "select all" on the HTML, and paste into Excel and it works smoothly.
The advantage of the XSL approach is the handling of the nested "sampleResult" elements if they are encountered. In the script below they are ignored. You can uncomment the XML comment that appears toward the end of the script and pick up the nested "sampleResult"s if you want but they really get in the way. The primary level "sampleResult" elements contain the sum of nested "sampleResult" times so this should be OK.
<xsl:stylesheet xmlns:xsl="http://www.w3.org/1999/XSL/Transform" version="1.0">
<xsl:output method="html" indent="yes" encoding="US-ASCII" doctype-public="-//W3C//DTD HTML 4.01 Transitional//EN" />

<xsl:template match="/">
  <html>
    <body>
       <xsl:apply-templates/>
    </body>
  </html>
</xsl:template>

<xsl:template match="testResults">
  <table border="1">
    <tr>
      <th>timeStamp</th>
      <th>dataType</th>
      <th>threadName</th>
      <th>label</th>
      <th>time</th>
      <th>responseMessage</th>
      <th>responseCode</th>
      <th>success</th>
    </tr>
    <xsl:apply-templates/>
  </table>
</xsl:template>


<xsl:template match="sampleResult">
  <tr>
    <td><xsl:value-of select="@timeStamp"/></td>
    <td><xsl:value-of select="@dataType"/></td>
    <td><xsl:value-of select="@threadName"/></td>
    <td><xsl:value-of select="@label"/></td>
    <td><xsl:value-of select="@time"/></td>
    <td><xsl:value-of select="@responseMessage"/></td>
    <td><xsl:value-of select="@responseCode"/></td>
    <td><xsl:value-of select="@success"/></td>
  </tr>
  <!--<xsl:apply-templates/>-->
</xsl:template>

</xsl:stylesheet>
It should be easy to apply this XSL stylesheet on your Jmeter file. I use a small Java program. I think you can add an xsl stylesheet processing instruction at the start of your XML file and open it in IE or Firefox directly. Someone can post on how to exactly do this.
Once within Excel, pivot tables are the way to go.
5. You can also use the following package that mixes Excel Macro, java transformation and xsl transformation of the .jtl files. It automatically generates Excel graphs using a Macro. The package is available here : scripts_jmeter.zip
Summarizing Huge Datasets
Shell Script to Aggregate Per Minute
As a software tester, sometimes you are called upon to performance test a web service (see BuildWSTest) and present results in a nice chart to impress your manager. JMeter is commonly used to thrash the server and produce insane amounts of throughput data. If you're running 1000 tpm this can be rather a lot of data (180,000 transactions for a 3 hour test run). Even using the Simple Data Writer, this is beyond the capability of JMeter's inbuilt graphics package and is too much to import to Excel.
My solution is to group throughput per minute and average transaction time for each minute. Attached below is a Bash script for processing a JTL log file from JMeter. It reduces a 3-hour test run to 180 data points which is much easier to represent with a chart program such as Excel.
The script uses a few neat awk tricks, such as:
- Rounding Java timestamps to nearest minute
- Collect timestamps grouped by minute
- Convert Java timestamp to YYYY-MM-dd etc.
- Print Throughput for a minute increment
- Print Average response time for a minute increment
- Do all of the above in an efficient single pass through awk (this was the hardest bit!)
Script: jtlmin.sh.txt
An example session, using jtlmin.sh to process a JTL file. The file produced, queryBalance.jtl.OUT (tab-delimited), can now be used to produce throughput graph. Response times can also be included on the secondary axis, as in the diagram above. These graphs were very good at showing when the integration layer was slow to respond and when throughput varied from the original JMeter plan.
$ jtlmin.sh
Usage: jtlmin.sh <filename>
Summarizes JMeter JTL output into 1-minute blocks

$ jtlmin.sh queryBalance.jtl
Processing queryBalance.jtl

$ ls q*
queryBalance.jtl  queryBalance.jtl.OUT

$ head queryBalance.jtl.OUT
/c/jmeter/performance/Myserver/output/queryBalance.jtl
unixtime        date    time    thruput(tpm)    response(ms)
1160354940      2006.Oct.09     13:49   65      0
1160355000      2006.Oct.09     13:50   0       0
1160355060      2006.Oct.09     13:51   0       0
1160355120      2006.Oct.09     13:52   56      0
1160355180      2006.Oct.09     13:53   98      108
1160355240      2006.Oct.09     13:54   84      125
1160355300      2006.Oct.09     13:55   0       0
1160355360      2006.Oct.09     13:56   0       0
Script: jtlmin.sh.txt
NB, here's a script to convert JMeter's Java timestamps: Script: utime2ymd.txt
Java Class to Quickly Summarize JMeter Results
I used the JMeter Ant task, http://www.programmerplanet.org/pages/projects/jmeter-ant-task.php, to produce very large output files. I wrote up this Java class to Summarize this information. I hope you find this useful. - Andy G.
Java Class: JMeterSummary.java
Sample Ouput:
All Urls:
cnt: 333, avg t: 535 ms, max t: 30755 ms, min t: 10 ms, result codes: {200=291, 302=42}, failures: 0, cnt by time: [0.0 s - 0.5 s = 312, 0.5 s - 1.0 s = 16, 30.5 s - 31.0 s = 5]
avg conn: 17 ms, max conn: 120 ms, min conn: 0 ms, elapsed seconds: 71 s, cnt per second: 5

URL: /
cnt: 27, avg t: 44 ms, max t: 90 ms, min t: 20 ms, result codes: {200=27}, failures: 0, cnt by time: [0.0 s - 0.5 s = 27]

URL: /home.html
cnt: 30, avg t: 173 ms, max t: 581 ms, min t: 70 ms, result codes: {200=30}, failures: 0, cnt by time: [0.0 s - 0.5 s = 27, 0.5 s - 1.0 s = 3]

URL: /news/
cnt: 9, avg t: 93 ms, max t: 120 ms, min t: 70 ms, result codes: {200=9}, failures: 0, cnt by time: [0.0 s - 0.5 s = 9]

URL: /signout.jsp
cnt: 21, avg t: 30 ms, max t: 60 ms, min t: 20 ms, result codes: {302=21}, failures: 0, cnt by time: [0.0 s - 0.5 s = 21]
...
cnt | number of requests |
avg t | average time per request |
max t | longest request |
min t | shortest request |
result codes | http result code and number of times received |
failures | number of failures |
cnt by time | a break down of how many requests returned in the specified time range |
avg conn | average time doing connection overhead (time ms - latency ms = conn ms) |
max conn | max connection overhead |
min conn | min connection overhead |
elapsed seconds | total elapsed time of test (last time stamp - first time stamp) |
cnt per second | throughput (number of requests / elapsed seconds) |
Based on this sort of input:
<?xml version="1.0" encoding="UTF-8"?>
<testResults version="1.2">
<httpSample t="511" lt="461" ts="1184177284608" s="true" lb="http://www.website.com/home.html" rc="200" rm="OK" tn="Thread Group 1-1" dt="text"/>
<httpSample t="581" lt="481" ts="1184177284718" s="true" lb="http://www.website.com/home.html" rc="200" rm="OK" tn="Thread Group 1-1" dt="text"/>
...
Postgres Script to Quickly Aggregate a CSV-format JTL
If you use CSV format logs, this method of summarizing one or more CSV files orders of magnitude faster than importing it into the Aggregate Report Listener. It requires PostgreSQL. Usage:
- jtlsummary.sh jtl_csv_result_files...
Extracting JTL files to CSV with Python (JMeter 2.3.x)
This script does two things. First it filters the JTL file for a regular expression. Then it strips them and outputs a CSV file. This also includes the conversion of the timestamp to a readable format.
The script only works with JTL files from JMeter 2.3.x (JTL version 2.1). Please see http://jakarta.apache.org/jmeter/usermanual/listeners.html#xmlformat2.1 for details.
Usage is:
- program.py <JTL input file> <CSV output file> "<regular expression>"
#!/usr/bin/python
""" Description : Split JTL file into a comma delimited CVS by : Oliver Erlewein (c)2008 Date : 04.02.2008 Lang : Python 2.4+

JMeter JTL field contents:

Attribute & Content by Bytes de Data encoding dt Data type ec Error count (0 or 1, unless multiple samples are aggregated) hn Hostname where the sample was generated lb Label lt Latency = time to initial response (milliseconds) - not all samplers support this na Number of active threads for all thread groups ng Number of active threads in this group rc Response Code (e.g. 200) rm Response Message (e.g. OK) s Success flag (true/false) sc Sample count (1, unless multiple samples are aggregated) t Elapsed time (milliseconds) tn Thread Name ts timeStamp (milliseconds since midnight Jan 1, 1970 UTC) """

import sys
import re
import datetime
import time

startTime = time.time()
cnt = 0
cnt2 = 0
failCnt = 0
reCompile = re.compile("\s([^\s]*?)=\"(.*?)\"")
delimiterCharacterOut = ","

def writeCSVLine(line):
	x = reCompile.findall(line)
	a = dict((row[0], row[1]) for row in x)
	try:
		a['ts'] = str(int(int(a['ts'])/1000))
		x = str(datetime.datetime.fromtimestamp(float(a['ts'])))[0:19]
		b = a['ts'] + ",\"" + x + "\"," + a['t'] + "," + a['lt'] + ",\"" + a['s'] + "\",\"" + a['lb'] + "\"," + a['rc'] + ",\"" + a['rm'] + "\",\"" + a['tn'] + "\",\"" + a['dt'] + "\"," + a['by'] + "\n"
	except:
		return -1
	o.write(b)
	return 1

print "Splitting JTL file"

try:
	runArgv = sys.argv # Save the command line
	jtlInfile = str(sys.argv[1]) # Name of JTL input file
	cvsOutfile = str(sys.argv[2]) # Name of CVS output file
	reFilter = str(sys.argv[3]) # Filter the labels (lb) for the filter
except:
	print "Error: Input format: <input file> <output file> <Filter by regular expression>"
	raise

try:
	f = open(jtlInfile, "r")
	o = open(cvsOutfile, "w")
except:
	raise

print "Filtering on regular expression : " + reFilter cmpFilter = re.compile(reFilter)

for line in f:
	try:
		if cmpFilter.search(line):
			returnVal = writeCSVLine(line)
			if returnVal < 0:
				failCnt += 1
			else:
				cnt2 += 1
	except:
		print 'Error in line : ', cnt, line
		raise

	cnt += 1

endTime = time.time()
print "Time taken : ", str(endTime-startTime)
print "Lines processed : ", cnt
print "Lines that passed the filter : ", cnt2
print "Lines skipped (error?) : ", failCnt

f.close()
o.close()
Generating charts with Perl
(Christoph Meissner) When it comes to exploit jmeters logfiles generated by many clients over a long testing period one might run into time consuming efforts putting all data together into charts. Present charts of jmeter relate response time to throughput. If you are working in larger enterprise environments it might also be interesting to see the relationship to the number of users who caused the requests. This applies even more when your company must make sure that it's applications can supply data to a certain number of employees over all day. Also it is very interesting to get a feeling in which range response times deviate as soon as your applications get stressed.
To reduce effort I'd like to present one of my Perl scripts here. It parses any number of jmeter logs and aggregates the data into several different charts (examples follow below):
chart type | comment |
stacked chart abs | cusps for aggregated respone times per measure point |
stacked chart rel | cusps for aggregated respone times per measure point expressed in percentages |
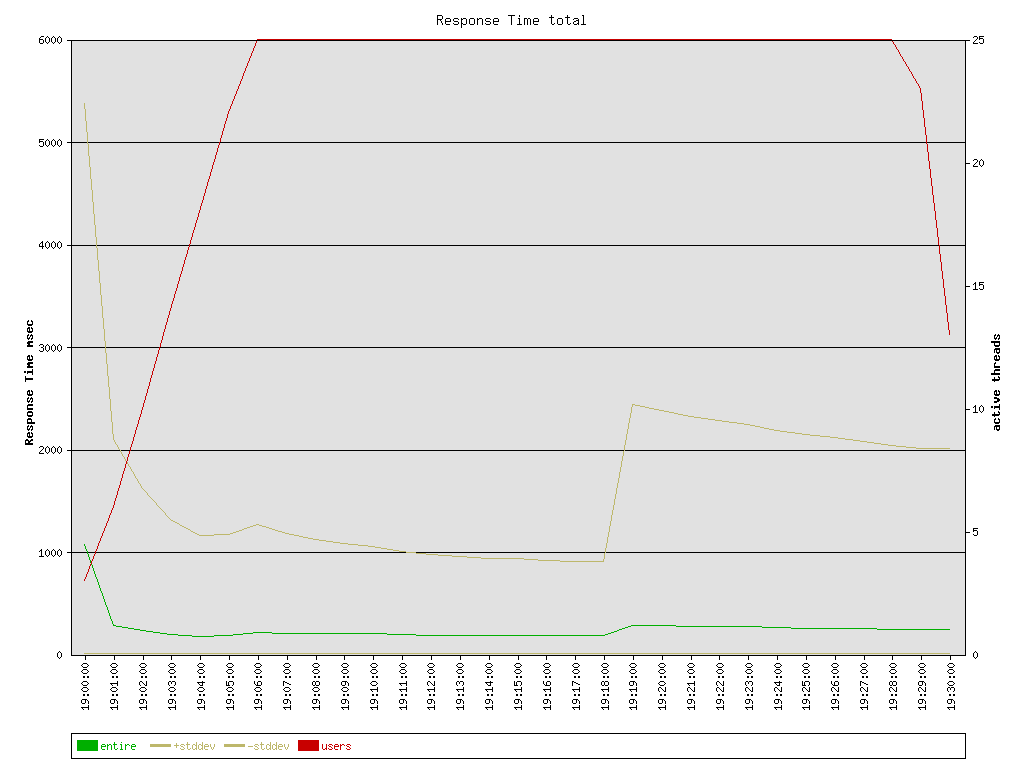
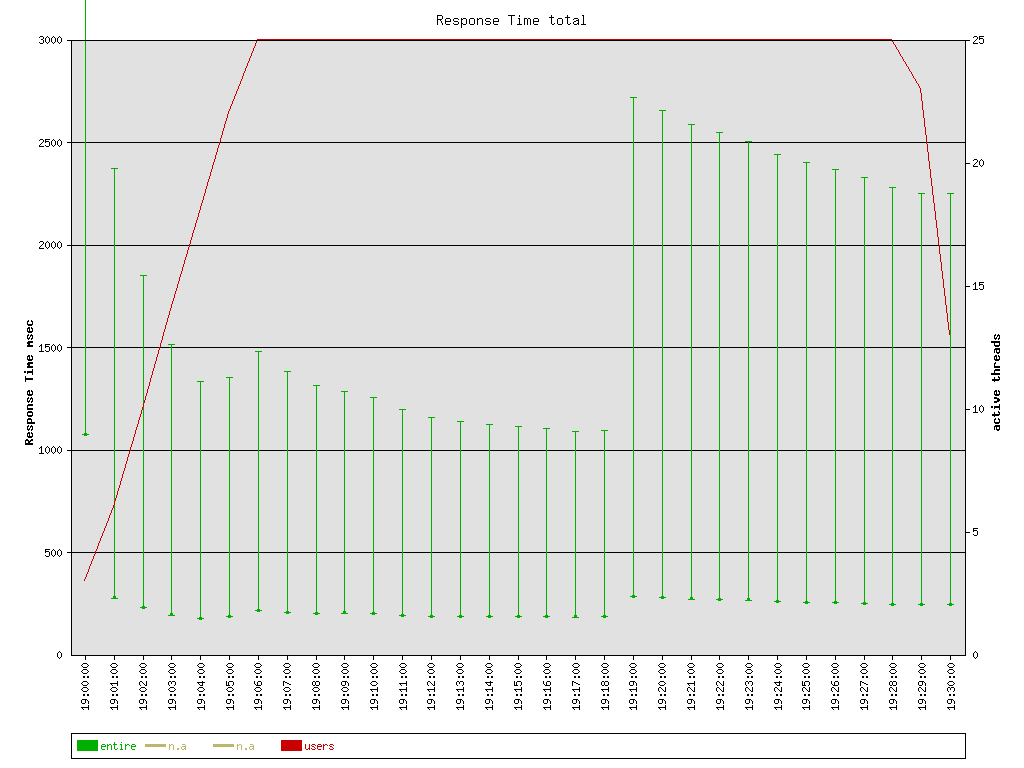
entire user | aggregated response times opposed to number of active threads |
entire throughput | aggregated response times opposed to throughput |
user | aggregated response times for this measure point opposed to number of active threads |
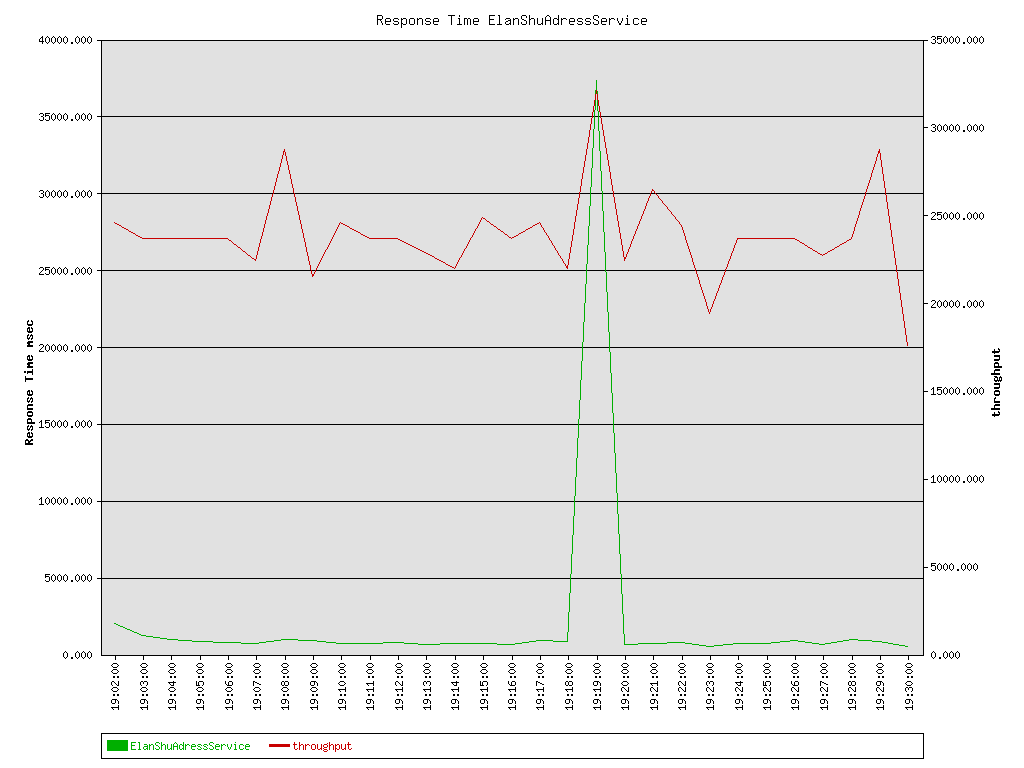
throughput | aggregated response times for this measure point opposed to number of active threads |
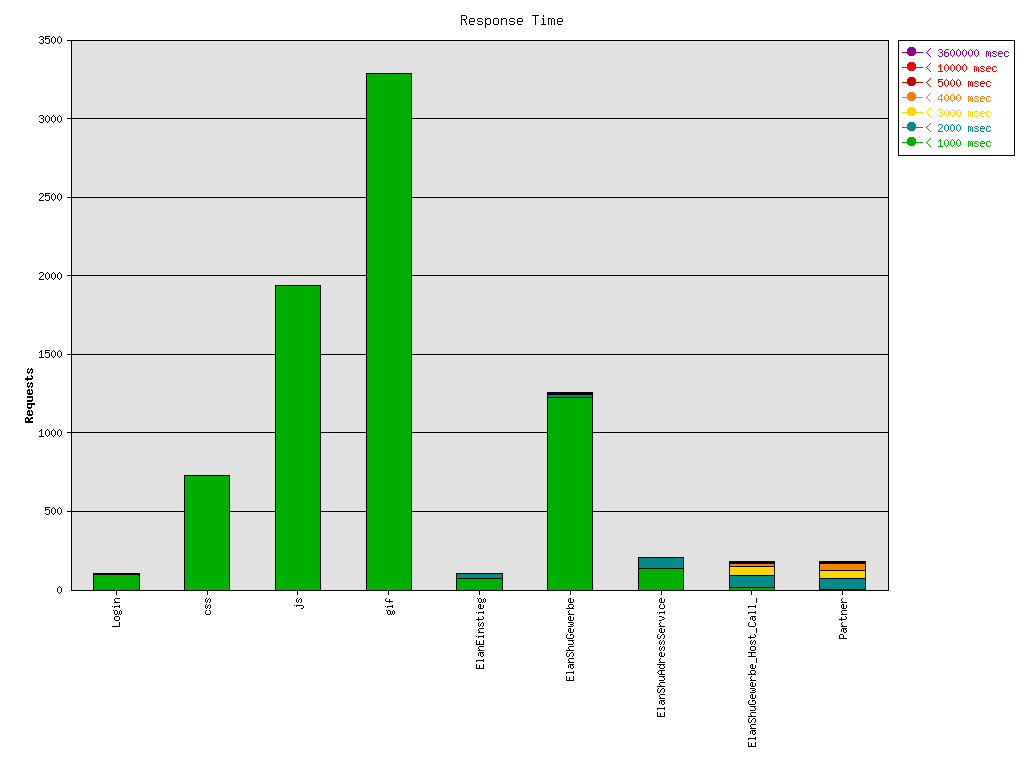
Here are exemplary charts showing a test against an address validation tool stressed with 25 active threads (a very small test ![]() ):
):
Stacked chart showing cusps of response times
Measure points are shown at the x-axis.
Stacked chart showing response times in %
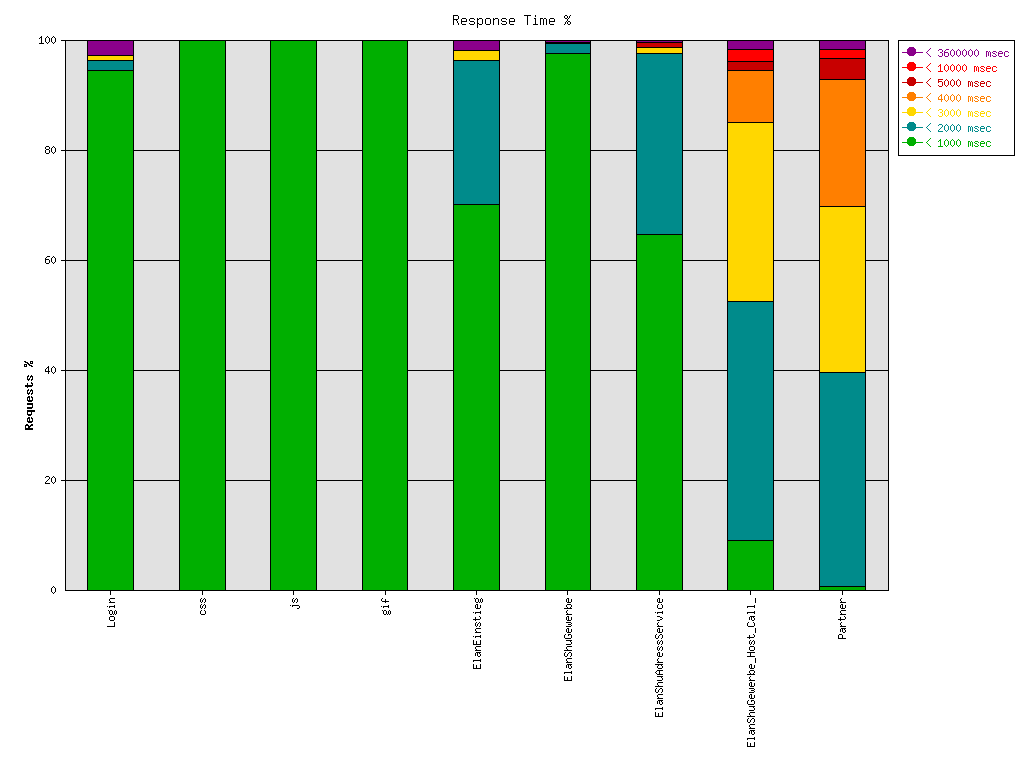
Chart opposing total response times to total threads
x-axis shows the timestamps of the test, left y-axis holds response times, right y-axis holds number of active threads (it is also possible to display a 1 standard deviation line for the response times (see script below)).
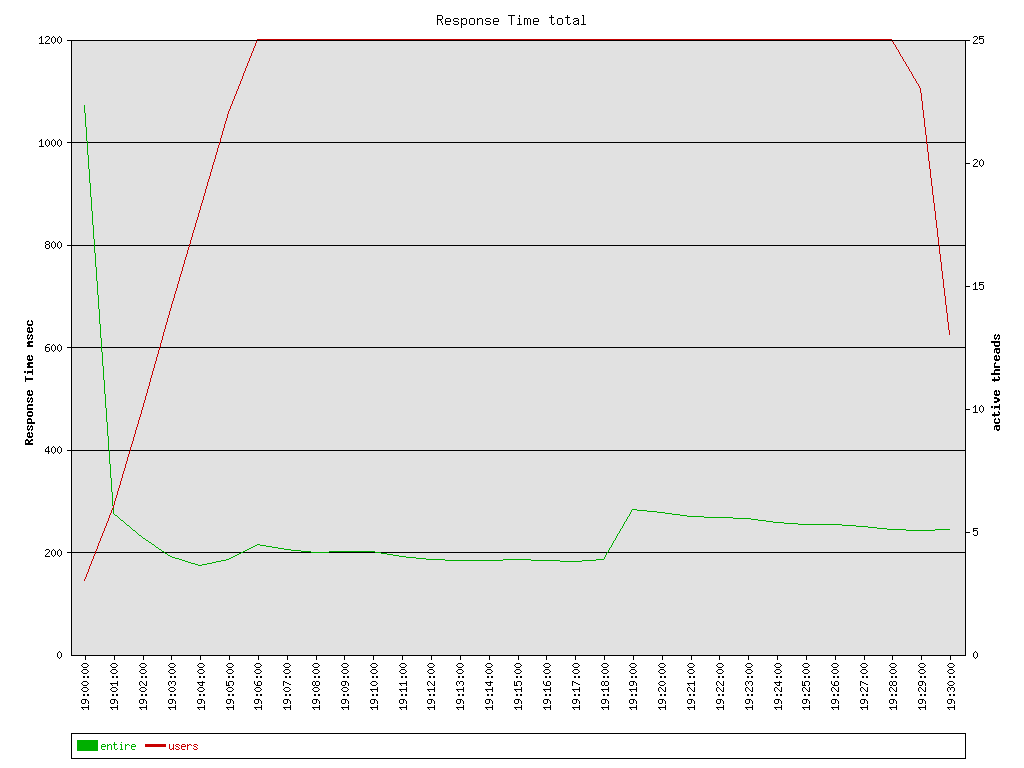
Chart opposing total response times to total throughput
x-axis shows the timestamps of the test, left y-axis holds response times, right y-axis holds throughput (it is also possible to display a 1 standard deviation line for the response times (see script below))
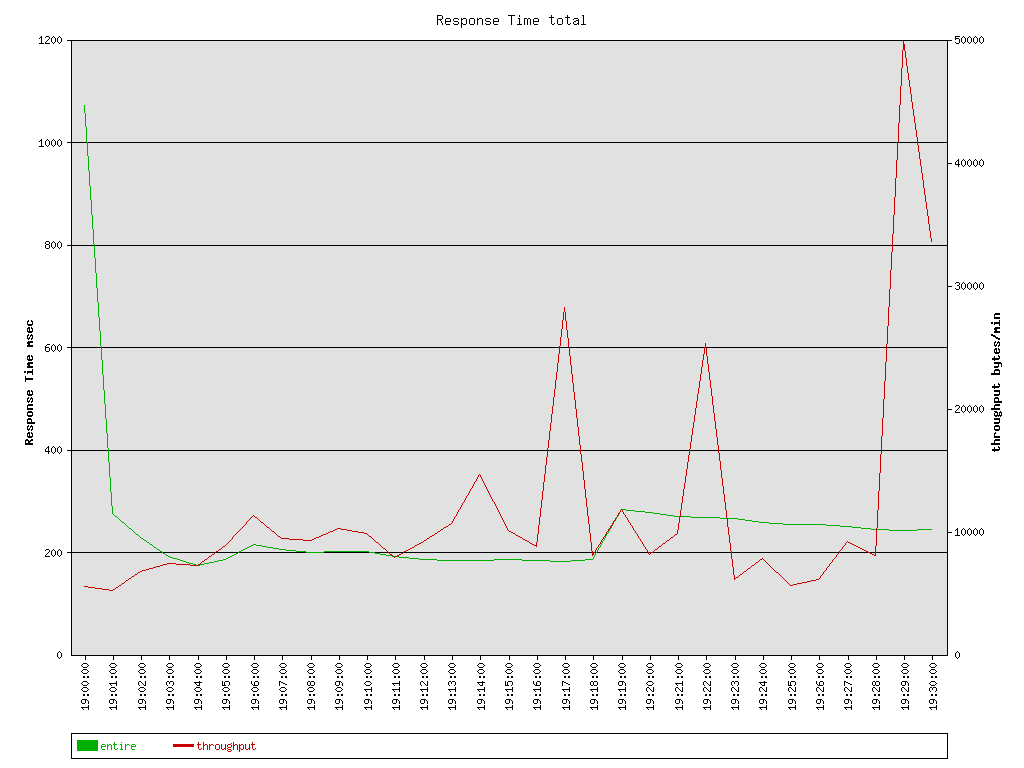
Chart opposing response times of a single measure point to active threads
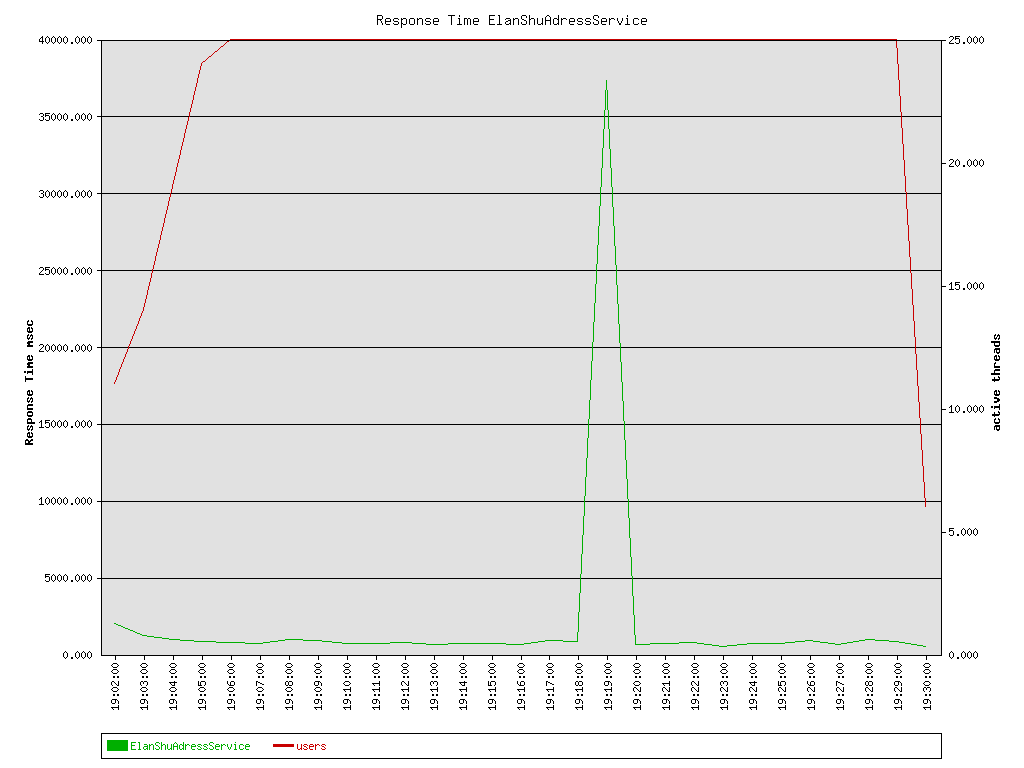
Chart opposing response times of a single measure point to throughput
Configure jmeters testplan
To make jmeter to generate appropriate log files you will have to configure your testplan properly.
One task will be to name your requests (the pipettes) in a way that allows the script to cumulate response times, active threads and throughput together into measure points. Also you will have to tell jmeter to log particular data.
For both requirements look at the example screenshot, please:
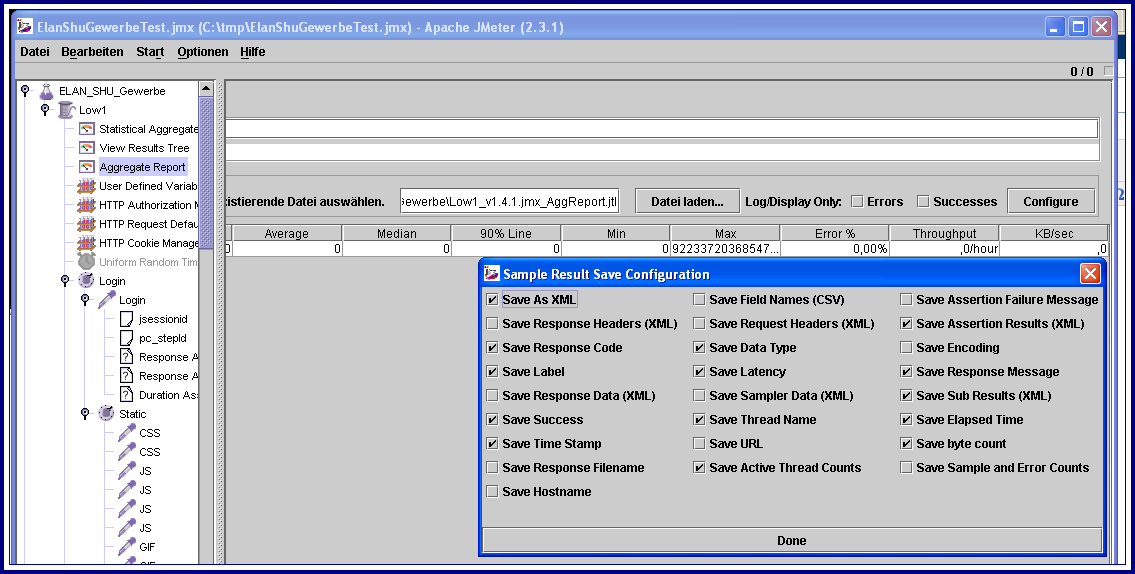
- insert an 'Aggregate Report' Listener to your testplan (top level).
- enter a filename where to save the results
- invoke 'Configure' and check the boxes as shown.
- Change the names of your requests. For instance in my exemplified testplan all requests for images were named as 'GIF', all requests for java scripts were named as 'JS'. Special points of interest also get their appropriate name (eg. 'Login', 'Address Search', ...). If you don't like particular requests to be accumulated then name them starting with garbage (eg. garbage_gif, garbage_js, ...) This step is necessary because the script collects data into labels of the same name. This way you make sure that you get a chart that will show the response times for all images or all 'Login' or all 'Address Searches' (except those that start with garbage)
The script
The jmetergraph.pl requires Chart 2.4.1 to be installed (http://search.cpan.org/~chartgrp/Chart-2.4.1/).
Updated the script as jmetergraphhtml.pl to include Mhardy's change below and to create an index.html page to view the graphs. Leaving the above in case I screwed it up. (aaronforster)
You can call the script in this way:
perl jmetergraph.pl [-alllb] [-stddev] [-range] <jtl file 1> [ ... <jtl file n>]
Normally jmetergraph.pl will not draw a stacked chart for requests that make less than 1% of entire number of requests. However, if you invoke jmetergraph.pl with -alllb then you will also see a stack for these requests (except request labels starting with garbage).
If you pass -stddev the graphs will show the normal standard deviation of the response times, too.
If you pass -range then a bar chart will be generated showing the average range of the reponse times.
(Not sure exactly where to put this, please forgive me, but this script is great with one minor minor bug. What a shame to have that ruin people's usage of it. Here's the patch that worked for me:
[mhardy@tkdevvm(192.168.146.130) util]$ diff jmetergraph.pl ~/mike/Desktop/jmetergraph.pl 313,314d312 < $glabels{'entire'} = %entire; <
...without that the "entire" .pngs don't contain data, Cheers, Mike)
JMeter Plugin for Hudson
The Hudson continuous integration server has a 'Performance' plugin that can execute and report on JMeter and JUnit tests, and generate charts on performance and robustness.