Java recommendation for Solr
For verions from 6.0.0 through 9.0.0, I would recommend Java 11. For 9.1.0 or later, I would recommend Java 17. Not sure I can recommend running any Solr version below 6.0.0. Java 17 is noticeably faster than Java 11 in my small-scale experiments.
In the past I would have strongly recommended never using an IBM Java. I don't know if that is still a good idea or not. IBM aggressively enables a large number of performance optimizations by default, which helps a lot with performance, but some of those optimizations have caused Solr/Lucene to encounter bugs in the past.
OpenJDK should be fine. Other Java varieties like Corretto (from Amazon) have been used with success. Oracle works well, but has a price tag. If you are already paying for Oracle Java, it's a great option.
GC Tuning for Solr
![]() Since version 5.0.0, the Solr start script has provided parameters for GC tuning. That tuning has been changed a few times over the versions, and since 8.1 it now defaults to G1GC.
Since version 5.0.0, the Solr start script has provided parameters for GC tuning. That tuning has been changed a few times over the versions, and since 8.1 it now defaults to G1GC.
The secret to good Solr GC tuning: Eliminating full garbage collections. A full garbage collection is almost always slow. If you can set up the options for GC such that it only does lower-pause concurrent collections, performance is almost guaranteed to be good.
Why is tuning necessary?
First you must understand how Java's memory model works, and what "garbage collection" actually means. I will not attempt to describe GC here ... click the link in the previous sentence or search the Internet if you want to know more.
The default garbage collector in Java is designed to do a decent job when the major concern of your program is throughput – how fast it can transfer data. If a high-throughput program pauses for several seconds, that's no big deal, as long as it is pumping data quickly the rest of the time.
Good Solr performance requires optimizing for a different metric – latency. The jobs that Solr is doing must complete very quickly, because when a user is searching, they are expecting results very quickly ... usually less than a second or two. If your website search feature sometimes takes several seconds to respond, users will find one of your competitors instead of using your website.
The default collector has all the wrong optimizations for Solr. In some ways that collector actually *prefers* full garbage collections. This preference helps throughput, because it means there are no collections at all for a very long time period, then the collector will spend a chunk of time (often tens of seconds) reclaiming a VERY large block of memory all at once. When that happens to a Solr install, any query that is underway will pause for many seconds. Java has other collector implementations that are designed for latency rather than throughput, but even these collectors will experience long pauses with Solr if they are left at their default settings. Further tuning is required.
The default collector in Java 9 and later is G1, but as just mentioned, if its settings are left at default, there will still be long pauses, though they may be less frequent.
G1 (Garbage First) Collector
This collector is default in java 9 and later, but requires additional tuning to work well with Solr. With that additional tuning, which is there by default in recent Solr versions, G1 works VERY well with smaller heaps. I've used it with good success with 8GB and 13GB heaps.
The following settings were created as a result of a discussion with Oracle employees on the hotspot-gc-use mailing list:
JVM_OPTS=" \
-XX:+UseG1GC \
-XX:+ParallelRefProcEnabled \
-XX:G1HeapRegionSize=8m \
-XX:MaxGCPauseMillis=200 \
-XX:+UseLargePages \
-XX:+AggressiveOpts \
"
Here's a graph of the GC times with the settings above. The heap size for this graph is -Xms4096M -Xmx6144M. All of the GC pauses are well under a second, and the vast majority of them are under a quarter second. The graph will be updated when more information is available:
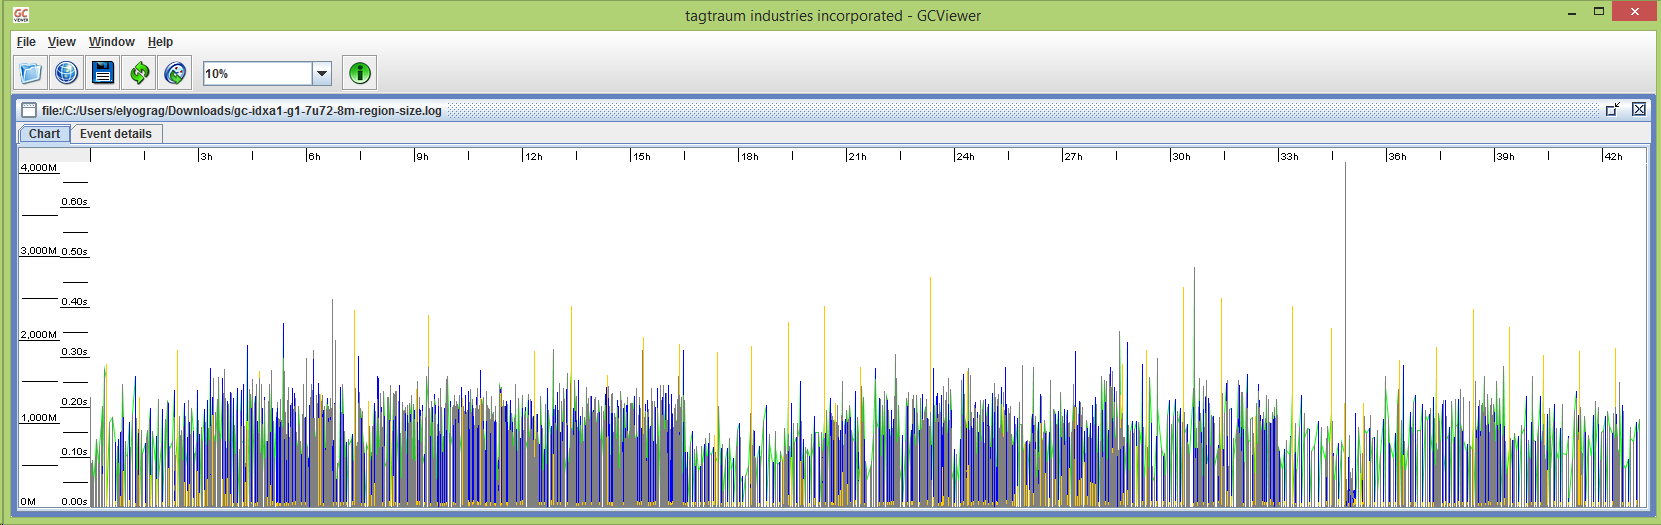
![]() Some notes about the G1HeapRegionSize parameter: I was seeing a large number of "humongous allocations" in the GC log, which means that they are larger than 50 percent of a G1 heap region. Those allocations were about 2MB in size, and my 4GB minimum heap results in a default region size of 2MB, which is calculated by dividing the -Xms value by 2048. I suspect that those allocations were for filterCache entries, because the indexes on that instance are each about 16.5 million documents, and the bitset memory structure of a filter for an index that size is a little over 2MB. Setting the region size to 8MB ensures that those allocations are not categorized as humongous. See "Humongous Allocations" section on this blog entry for more information.
Some notes about the G1HeapRegionSize parameter: I was seeing a large number of "humongous allocations" in the GC log, which means that they are larger than 50 percent of a G1 heap region. Those allocations were about 2MB in size, and my 4GB minimum heap results in a default region size of 2MB, which is calculated by dividing the -Xms value by 2048. I suspect that those allocations were for filterCache entries, because the indexes on that instance are each about 16.5 million documents, and the bitset memory structure of a filter for an index that size is a little over 2MB. Setting the region size to 8MB ensures that those allocations are not categorized as humongous. See "Humongous Allocations" section on this blog entry for more information.
Garbage collection for allocations that are tagged as humongous is not fully handled in the concurrent and low-pause parts of the process. They can only be properly handled by a full garbage collection, which will always be slow. Depending on the size of your indexes and the size of your heap, the region size may require adjustment from the 8MB that I am using above. If you have an index with about 100 million documents in it, you'll want to use a region size of 32MB, which is the maximum possible size. Because of this limitation of the G1 collector, we recommend always keeping a Solr index below a maxDoc value of around 100 to 120 million.
Further down on this page, I have included GC logging options that will create a log you can search for "humongous" to determine if there are a lot of these allocations. I have been told that with Java 8u40 or later, the !G1HeapRegionSize parameter is not required, because Java 8 manages large allocations a lot better than Java 7 does.
Current experiments
I no longer have access to large Solr installs. My personal install is providing full text search for dovecot, which manages all the email for my personal domains and a few domains that I host for others. This is the current settings for GC Tuning in /etc/default/solr.in.sh on that server:
SOLR_HEAP="1g"
#GC_TUNE=" \
#  -XX:+UseG1GC \
#  -XX:+ParallelRefProcEnabled \
#  -XX:MaxGCPauseMillis=100 \
#  -XX:+ExplicitGCInvokesConcurrent \
#  -XX:+UseStringDeduplication \
#  -XX:+AlwaysPreTouch \
#  -XX:+UseNUMA \
#"
#GC_TUNE=" \
#  -XX:+UseShenandoahGC \
#  -XX:+ParallelRefProcEnabled \
#  -XX:+ExplicitGCInvokesConcurrent \
#  -XX:+UseStringDeduplication \
#  -XX:+AlwaysPreTouch \
#  -XX:+UseNUMA \
#"
GC_TUNE=" \
  -XX:+UnlockExperimentalVMOptions \
  -XX:+UseZGC \
  -XX:+ParallelRefProcEnabled \
  -XX:+ExplicitGCInvokesConcurrent \
  -XX:+UseStringDeduplication \
  -XX:+AlwaysPreTouch \
  -XX:+UseNUMA \
"
As you can see, I have three different groups of settings, for G1, Shenandoah, and ZGC. The Shenadoah collector showed a lot of promise, but it seems to have been removed from recent Java 11 and later versions.
![]() In the past I would have added -XX:+PerfDisableSharedMem to the GC tuning options because of something that is called the four month bug. I have gotten around that in another way for my install ... /tmp is a memory-based filesystem (tmpfs). For small systems or a system that is running only Solr, this is a good option. For large installations running other software, a large amount of data may need to be placed in /tmp, and that data may need to survive a reboot, so using a memory-based filesystem can be problematic.
In the past I would have added -XX:+PerfDisableSharedMem to the GC tuning options because of something that is called the four month bug. I have gotten around that in another way for my install ... /tmp is a memory-based filesystem (tmpfs). For small systems or a system that is running only Solr, this is a good option. For large installations running other software, a large amount of data may need to be placed in /tmp, and that data may need to survive a reboot, so using a memory-based filesystem can be problematic.
Some notes about ZGC:
My current experiments are using Java 17 and ZGC. My observations are that G1GC can do a full reindex faster than ZGC, but has distinctly longer GC pauses. Note that "longer" is still VERY small, below human perception levels. Also, a full reindex on my system is mostly single-threaded. I suspect that installs with a VERY large heap or doing heavily multi-threaded indexing will REALLY shine when running ZGC.
ZGC is not available on a 32 bit Java, and always uses 64 bit pointers, so there is no advantage to setting the heap size below 32GB, as there is with G1 and older collectors.
ZGC claims that its pause times do NOT increase as the heap gets larger. Older collectors like Parallel, CMS, and G1 do show an increase in pause times as the heap grows.
CMS (ConcurrentMarkSweep) Collector
CMS, with proper tuning, did a very good job. But G1 does better, and ZGC shows incredible promise. So the notes about CMS have been removed from this page.
The UseLargePages Option
A note about the UseLargePages option: Currently I do not have huge pages allocated in my operating system. This option will not actually do anything unless you allocate memory to huge pages. If you do so, memory usage reporting with the "top" command will probably only show a few hundred MB of resident memory used by your Solr process, even if it is in fact using several gigabytes of heap. If you do enable huge pages in Linux, be aware that you might wish to turn off an operating system feature called transparent huge pages.
Garbage Collection Logging
I do not have any suggested changes for GC logging from the defaults that Solr already includes.
Init scripts
Solr now includes a service installer that does a great job.