Cluster Monitoring and Management w/ OpenNMS
Introduction
We can break cluster/network management down into a couple of areas:
- Real-time monitoring of service availability. 2. Collection and trending of data to better understand cluster performance.
For (1), we're looking at things like "Are my nodes up? Do they respond to an ICMP ping?", or "Is the thrift service listening? Is it capable of responding to RPC requests?".
With (2) we're interested in collecting and reporting on data that will help us answer questions like, "What is the rate of storage consumption? When will I need to add capacity?" or "At what point does load start to adversely effect read/write latency?"
OpenNMS is a Free Software (GPL) network management platform written in Java. This page will document configuration and best practices when using OpenNMS for monitoring, data-collection, and management of Cassandra clusters.
Note: It is beyond the scope of this document to detail anything already covered in the actual docs.
Disclaimer: This page is a very early draft. No claims are made with respect to accuracy or completeness. Reading this might very well make you dumber. You have been warned.
Service Polling
Nada
Data Collection
Capability Detection
If you are using the Cassandra default of 8080 for JMX, then you'll need to comment out the definition for HTTP-8080 (it conflicts).
File: capsd-configuration.xml
<protocol-plugin protocol="JSR160-8080" scan="on" user-defined="false"
        class-name="org.opennms.netmgt.capsd.plugins.Jsr160Plugin">
    <property key="port" value="8080"/>
    <property key="type" value="default"/>
</protocol-plugin>
Collection
File: jmx-datacollection-config.xml
<jmx-collection name="JSR160-8080" maxVarsPerPdu = "50">
    <rrd step = "300">
        <rra>RRA:AVERAGE:0.5:1:8928</rra>
        <rra>RRA:AVERAGE:0.5:12:8784</rra>
        <rra>RRA:MIN:0.5:12:8784</rra>
        <rra>RRA:MAX:0.5:12:8784</rra>
    </rrd>

    <mbeans>
        <mbean name="cf.keyspace1.standard1"
                objectname="org.apache.cassandra.db:type=ColumnFamilyStores,name=Keyspace1,columnfamily=Standard1">
            <attrib alias="ReadLatency" type="gauge" name="ReadLatency"/>
            <attrib alias="WriteLatency" type="gauge" name="WriteLatency"/>
            <attrib alias="PendingTasks" type="gauge" name="PendingTasks"/>
            <attrib alias="ReadCount" type="gauge" name="ReadCount"/>
            <attrib alias="WriteCount" type="gauge" name="WriteCount"/>
            <attrib alias="MemtableSwitchCount" type="gauge"
                    name="MemtableSwitchCount"/>
            <attrib alias="MemtableColumnCount" type="gauge"
                    name="MemtableColumnsCount"/>
            <attrib alias="MemtableDataSize" type="gauge"
                    name="MemtableDataSize"/>
        </mbean>
    </mbeans>
</jmx-collection>
File: collectd-configuration.xml
<service name="JSR160-8080" interval="300000" user-defined="false"
        status="on">
    <parameter key="port" value="8080"/>
    <parameter key="protocol" value="rmi"/>
    <parameter key="urlPath" value="/jmxrmi"/>
    <parameter key="collection" value="JSR160-8080"/>
    <parameter key="friendly-name" value="JSR160-8080"/>
</service>
<collector service="JSR160-8080"
        class-name="org.opennms.netmgt.collectd.Jsr160Collector"/>
/var/lib/opennms/rrd/snmp/<nodeid>/JSR160-8080/<alias>.jrb
Reports/Graphs
File: snmp-graph.properties
report.cassandra.cf.latency.name=Keyspace1.Standard1 Latency
report.cassandra.cf.latency.columns=ReadLatency,WriteLatency
report.cassandra.cf.latency.type=interfaceSnmp
report.cassandra.cf.latency.command=--title="Read/write Latency" \
 DEF:readlatency={rrd1}:ReadLatency:AVERAGE \
 DEF:minReadlatency={rrd1}:ReadLatency:MIN \
 DEF:maxReadlatency={rrd1}:ReadLatency:MAX \
 DEF:writelatency={rrd2}:WriteLatency:AVERAGE \
 DEF:minWritelatency={rrd2}:WriteLatency:MIN \
 DEF:maxWritelatency={rrd2}:WriteLatency:MAX \
 LINE2:readlatency#0000ff:"Read latency" \
 GPRINT:readlatency:AVERAGE:"  Avg  \\: %5.2lf %s" \
 GPRINT:minReadlatency:MIN:"Min  \\: %5.2lf %s" \
 GPRINT:maxReadlatency:MAX:"Max  \\: %5.2lf %s\\n" \
 LINE2:writelatency#00ff00:"Write latency" \
 GPRINT:writelatency:AVERAGE:" Avg  \\: %5.2lf %s" \
 GPRINT:minWritelatency:MIN:"Min  \\: %5.2lf %s" \
 GPRINT:maxWritelatency:MAX:"Max  \\: %5.2lf %s\\n"
reports=mib2.HCbits, mib2.bits, mib2.percentdiscards, mib2.percenterrors, \
mib2.discards, mib2.errors, mib2.packets, \
...
xmp.procs,xmp.filesys,xmp.xmpdstats,xmp.diskstats,xmp.diskkb, \
cassandra.cf.latency
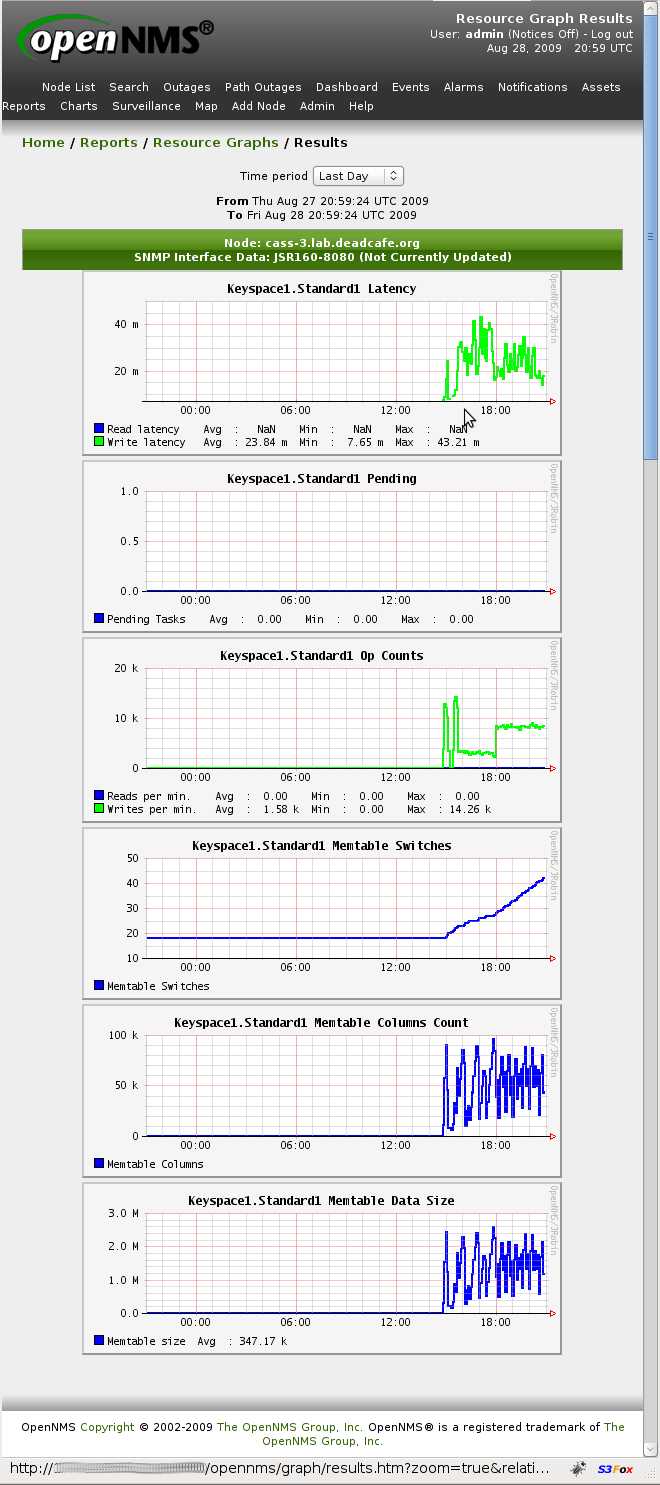
A sample report.
