_ _
JMeter Performance evolution across versions (>= 2.5.1)
This article is the record of a Test done in the following conditions:
- Tomcat version 6.0.24
- Tomcat JVM : -Xms256m -Xmx1024m
- JMeter JVM : -Xmx512m
- Set session timeout in web.xml to 1 minute
- Java version "1.6.0_29"
- Java(TM) SE Runtime Environment (build 1.6.0_29-b11-402-10M3527)
- Java HotSpot(TM) 64-Bit Server VM (build 20.4-b02-402, mixed mode)
- Mac OS 10.6.8
- JMeter and Tomcat on same machine
- No particular OS Tuning
- RAM : 8 Go 1067 MHz DDR3
- Processor : 3.06 GHz Intel Core 2 Duo
- No swap
- Simple Test plan using Tomcat examples
- 10 minutes run
Test Plan:
Test Plan used :
TestPlan
JMETER 2.5.1
Transactions:
![]()
JVM Behaviour:
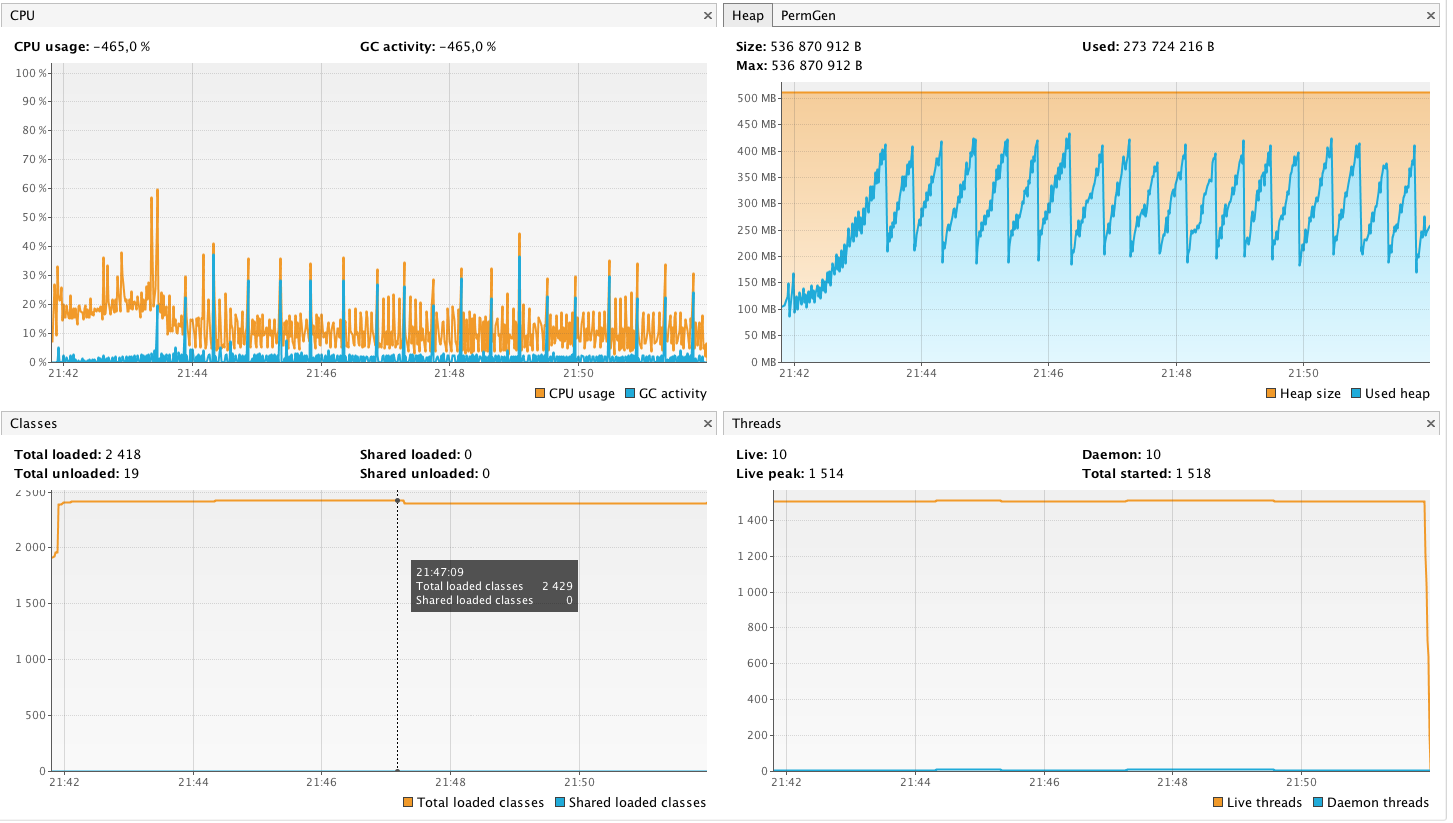
GC Activity:
- GC activity is much higher with around 5 GC CPU peaks every 2 minutes
- and 20 FULL GC of 700 to 800 ms each
- Throughput: 97,71%
- Pauses : 13,69s
- Memory Cleaned : 391m/min
- Full GC tend to be much more frequent at end of test
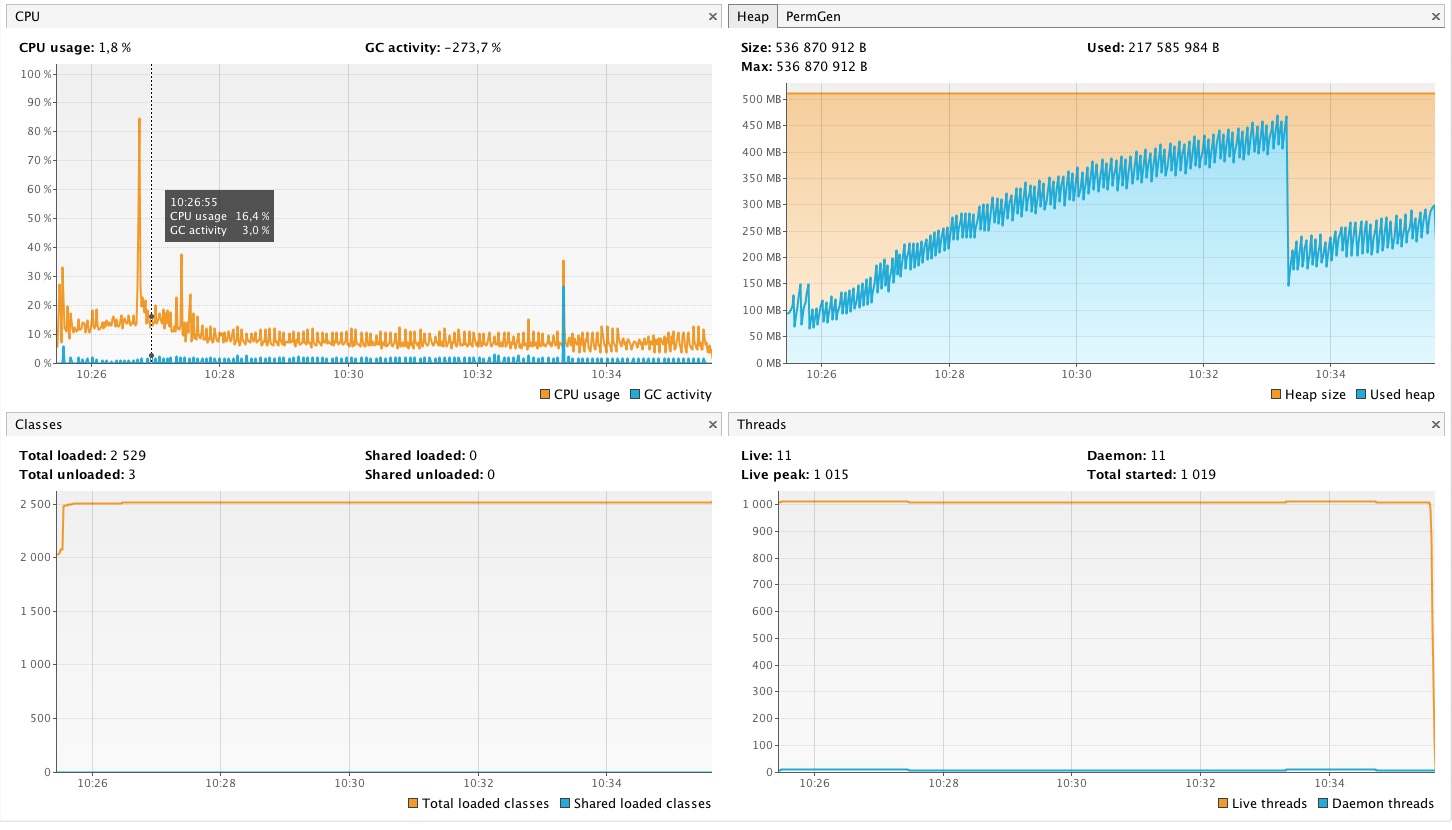
JMETER 2.6:
Transactions:
![]()
JVM Behaviour:
JMETER 2.7:
Transactions:
![]()
JVM Behaviour:
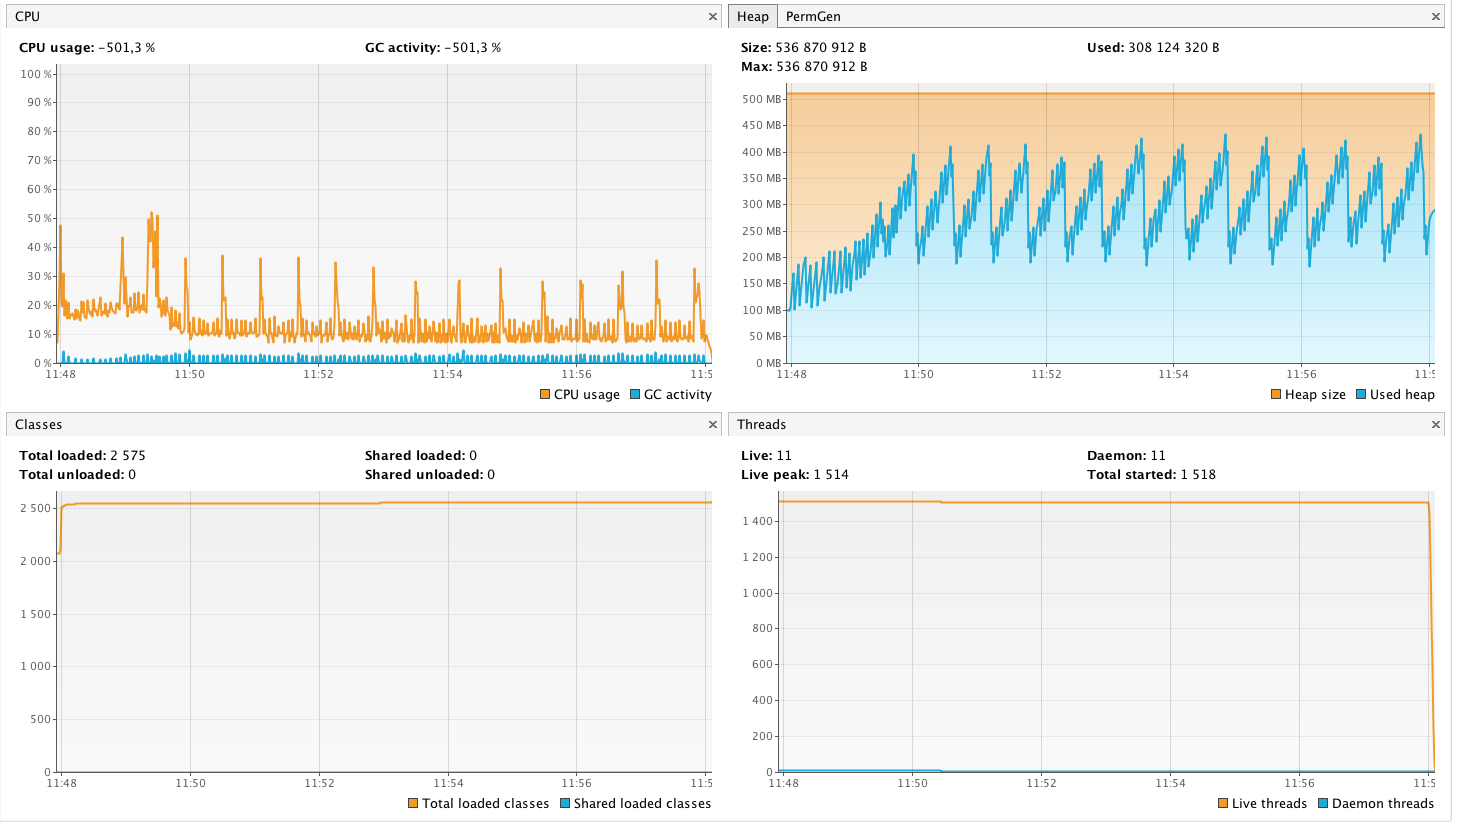
GC Activity:
- No GC CPU peak,
- 1 FULL GC
- Throughput:98.54
- Pauses : 8.9s
- Memory cleaned: 1108m /min
Conclusion
- Better memory behaviour
- More accurate response times with High Load